IC Markets Home Sign in Web Trader Contact Us
IC Markets Social IC Markets Social

Information Hub for
Serious Traders

  • ABOUT US
  • OPEN LIVE ACCOUNT
  • OPEN DEMO ACCOUNT
  • TRADE NOW
  • VISIT OUR BLOG
IC Markets Social
  • ABOUT US
  • OPEN LIVE ACCOUNT
  • OPEN DEMO ACCOUNT
  • TRADE NOW
  • VISIT OUR BLOG
July 5, 2024North_American_Stocks_esIC Markets

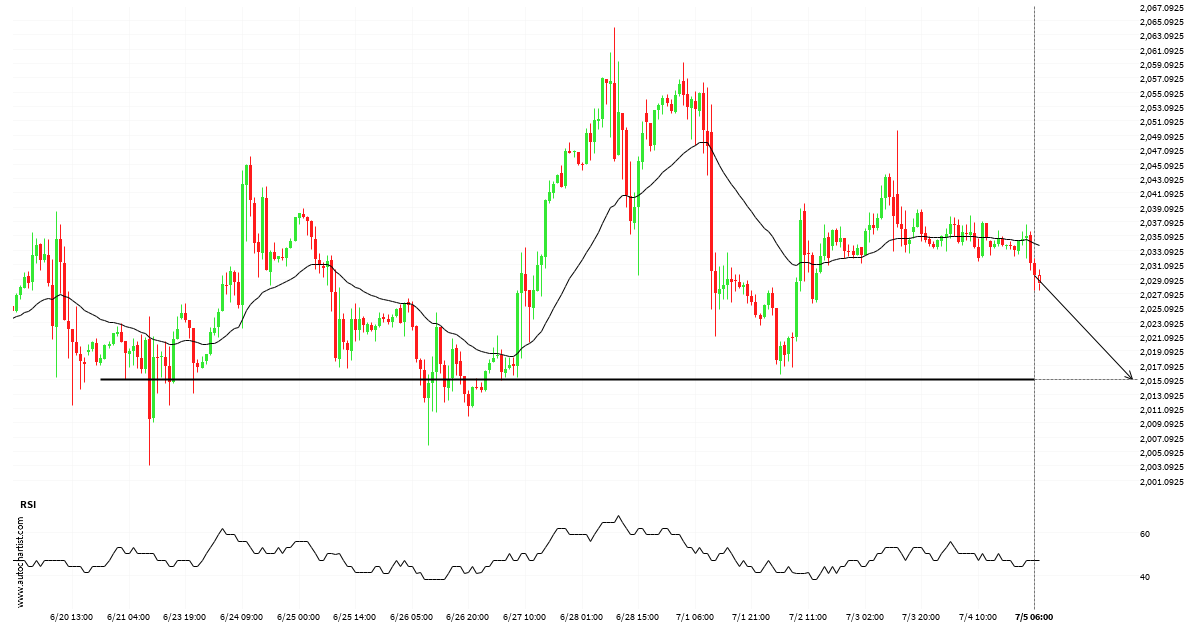
US Small Cap 2000 Index acercándose a un importante nivel bajista clave

El US Small Cap 2000 Index avanza hacia 2015.1100 y podría alcanzar este punto en un plazo de 3 días. Ha probado esta línea previamente en numerosas ocasiones y esta vez no tiene porqué ser diferente, terminando con una recuperación en lugar de en una rotura. Si la rotura no ocurre, podríamos observar un retroceso […]

Read more
July 4, 2024North_American_Stocks_esIC Markets

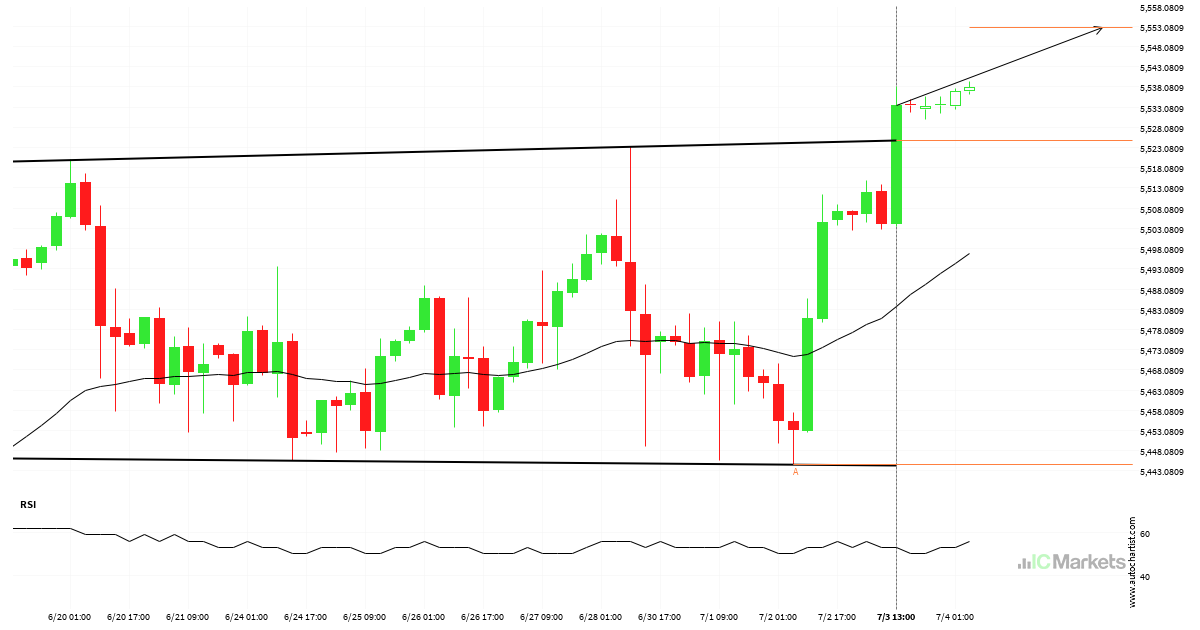
El US SPX 500 Index ha atravesado la resistencia

US SPX 500 Index atravesó la línea de resistencia de un patrón de Rectángulo en 5524.702105263158 en el gráfico de 4 Hora. Esta línea se ha testeado varias veces en el pasado y esta rotura podría significar un próximo cambio de la tendencia actual. Puede continuar en su dirección actual hacia 5552.6737.

Read more
July 3, 2024North_American_Stocks_esIC Markets

US Small Cap 2000 Index – acercándose a la resistencia del Canal alcista

El US Small Cap 2000 Index se está acercando a la línea de resistencia de un Canal alcista. Ha llegado a esta línea en numerosas ocasiones durante los últimos 12 días. Si vuelve a probarla de nuevo, debería hacerlo en las próximas 3 días.

Read more
July 2, 2024North_American_Stocks_esIC Markets

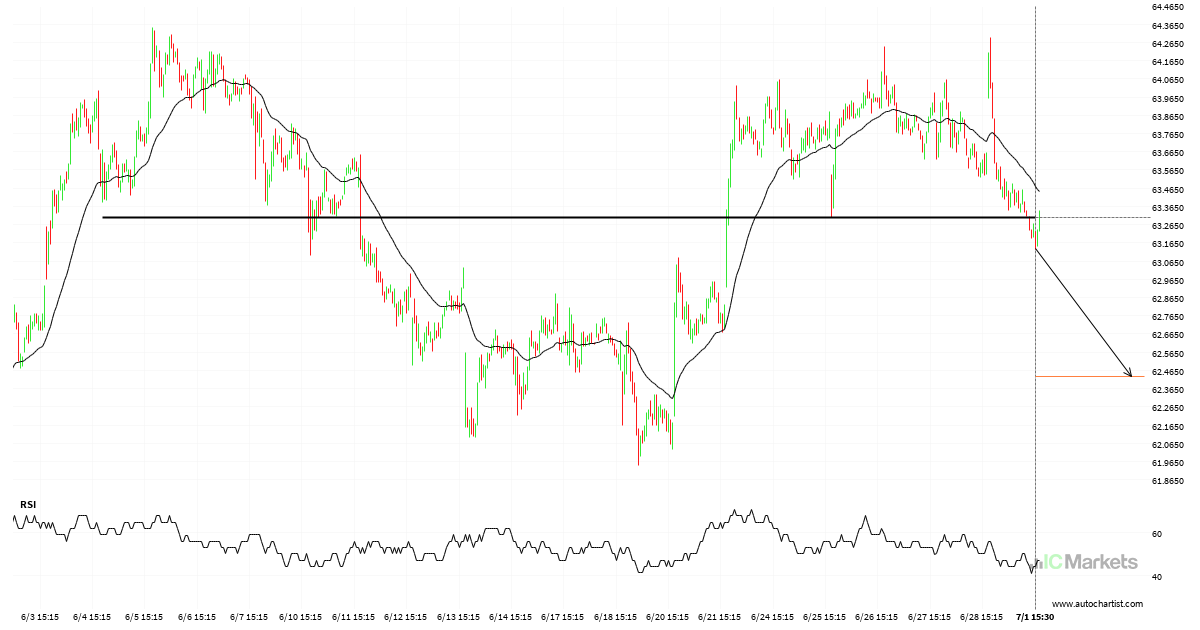
Rotura de Coca-Cola Co. a través de nivel de soporte

Se ha atravesado un fuerte nivel de soporte en 63.3050 en el gráfico de 15 Minutos de Coca-Cola Co.. La teoría del análisis técnico pronostica un movimiento a 62.4330 en el próximo período de día.

Read more
July 1, 2024North_American_Stocks_esIC Markets

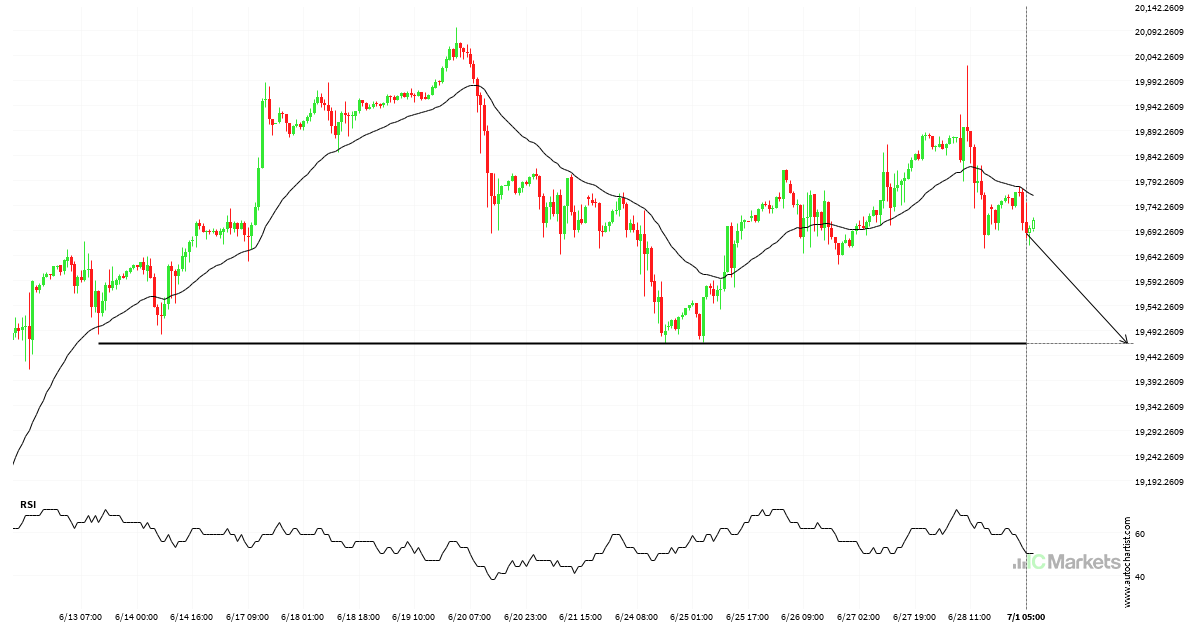
US Tech 100 Index se acerca a un nivel importante en 19466.0391

El US Tech 100 Index avanza hacia 19466.0391 y podría alcanzar este punto en un plazo de 3 días. Ha probado esta línea previamente en numerosas ocasiones y esta vez no tiene porqué ser diferente, terminando con una recuperación en lugar de en una rotura. Si la rotura no ocurre, podríamos observar un retroceso de […]

Read more
June 28, 2024North_American_Stocks_esIC Markets

¿Se perdió este movimiento en US Small Cap 2000 Index?

US Small Cap 2000 Index llegó a 2052.11 después de un movimiento del 2,02% que ha durado 2 días.

Read more
June 27, 2024North_American_Stocks_esIC Markets

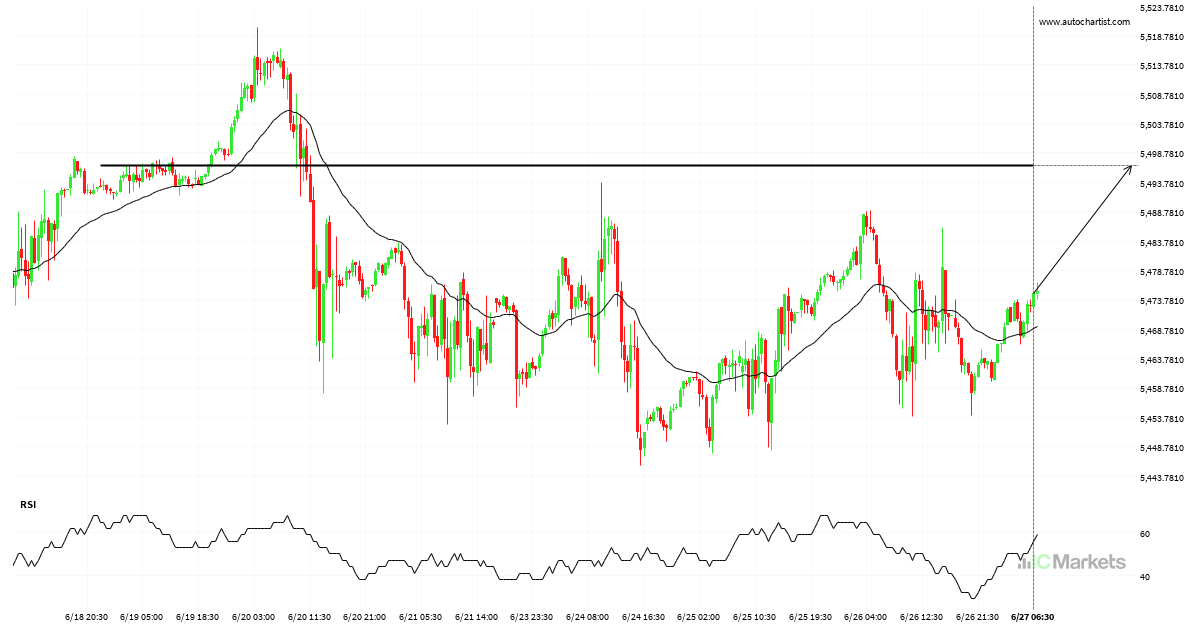
US SPX 500 Index: plan para operación alcista a corto plazo hasta 5496.6602

Se identificó un fuerte nivel de resistencia en 5496.6602 en el gráfico de 30 Minutos de US SPX 500 Index. Es probable que US SPX 500 Index lo testee pronto.

Read more
June 26, 2024North_American_Stocks_esIC Markets

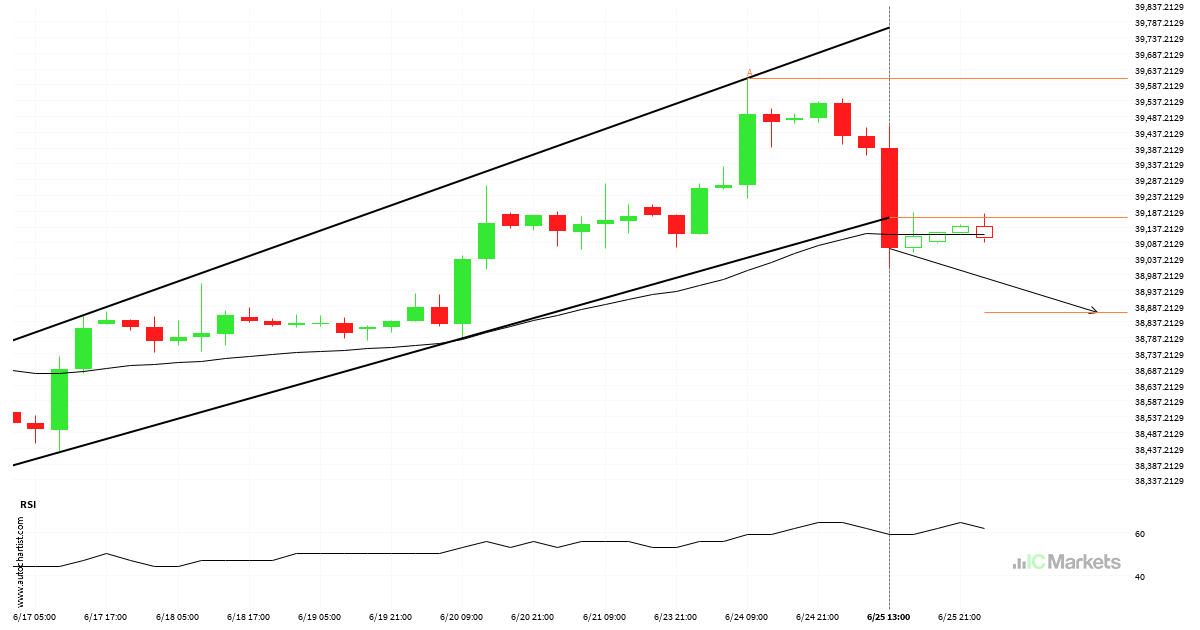
¿Se espera una tendencia bajista para el US Wall Street 30 Index?

La irrupción del US Wall Street 30 Index a través de la línea de soporte de un Canal alcista podría ser una señal de la ruta a seguir. Si esta irrupción persiste, podríamos ver el US Wall Street 30 Index probando el nivel de 38867.4126 dentro de las próximas 2 días.

Read more
June 24, 2024North_American_Stocks_esIC Markets

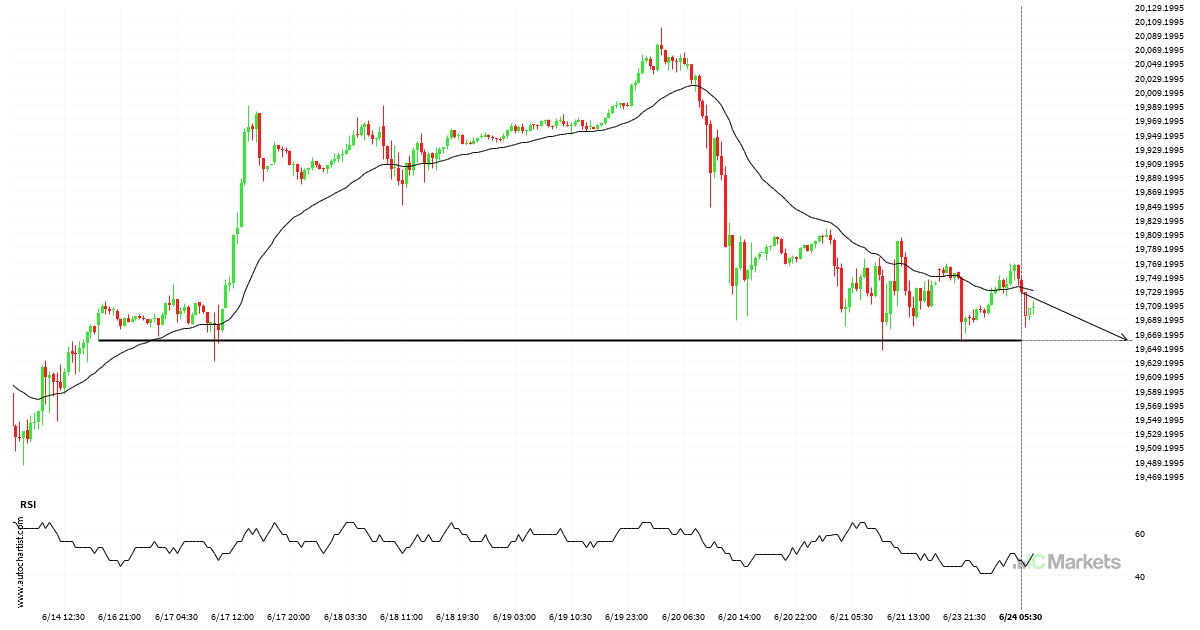
US Tech 100 Index acercándose a nivel de soporte

El precio de US Tech 100 Index ha vuelto a la zona de soporte. Es posible que tenga dificultades para atravesarla y que retroceda en la otra dirección. El precio eventualmente puede romper, pero normalmente el precio rebota en el nivel varias veces antes de hacerlo.

Read more
June 20, 2024North_American_Stocks_esIC Markets

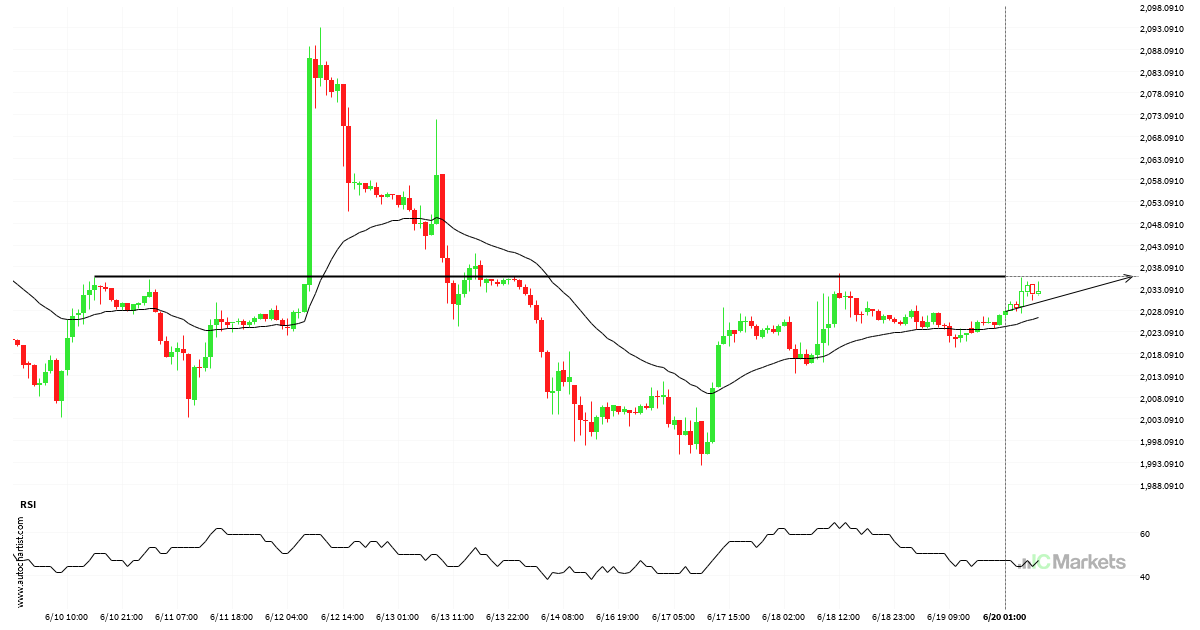
Inminente irrupción de una importante línea de precio del US Small Cap 2000 Index

US Small Cap 2000 Index está a punto de volver a testear un nivel de resistencia horizontal clave, cerca de 2035.9100. Ha testeado este nivel 7 veces recientemente y podría simplemente rebotar como lo hizo la última vez. Sin embargo, después de tantos intentos, tal vez esté listo para empezar una nueva tendencia.

Read more
  • 1
  • 2
  • 3
  • …
  • 10
  • 11
  • 12
  • 13
  • 14
  • 15
  • 16
  • …
  • 89
  • 90
  • 91

Recent Posts

  • Either a rebound or a breakout imminent on SILVER
  • GOLD Nível visado: 2976.3601
  • A potential bearish movement on GOLD
  • มีโอกาสเกิดการเคลื่อนตัวแบบ bearish บน GOLD
  • Posible gran movimiento en el AUDJPY

Recent Comments

    Translation


     Edit Translation

    Trade with

    a market leader you can rely on

    Open Trading Account Try a Free Demo

    Forex Trading

    • Accounts Overview
    • Open an Account
    • Launch Web Trader

    Trading Specifications

    • Spreads and Commissions
    • Range of Market
    • Trading Hours
    • Funding
    • Withdrawal

    About IC Markets

    • Help Center
    • Why IC Markets
    • Regulation
    • Legal Documents
    • Contact Us


    Forex Trading

    • Accounts Overview
    • Open an Account
    • Launch Web Trader

    Trading Specifications

    • Spreads and Commissions
    • Range of Market
    • Trading Hours
    • Funding
    • Withdrawal

    About IC Markets

    • Chat with a Specialist 24/7
    • Why IC Markets
    • Regulation
    • Legal Documents
    • Contact Us

    Disclaimer: This material is marketing material where all marketing material is published for informational purposes only. This material does not contain and should not be considered as containing - investment advice and recommendations, or suggestions for performing any actions with financial instruments. The built-in widgets belong to their external independent authors, and IC Markets is not responsible for their content and their impact on trade.

    All content rights reserved. Opinions of the authors may not coincide with the opinion of the blog editors. When copying materials from this site or connecting to an RSS feed to republish our articles, a link to IC Markets or attribution in the format ‘IC Markets Blog’ is required. For general questions, please contact the editorial office via the form on the Contact us page.

    Risk Warning: Trading Derivatives carries a high level of risk to your capital and you should only trade with money you can afford to lose. Trading Derivatives may not be suitable for all investors, so please ensure that you fully understand the risks involved and seek independent advice if necessary. A Product Disclosure Statement (PDS) should be considered before entering into a transaction with us.

    The contents of this page are general information only and does not take into account your personal situation, financial objectives or needs. It is up to you to make sure the products that we offer suit your specific needs. You should not trade with us unless you understand the features and risks of the products that we offer. This means that you might need to seek independent advice before you start trading with us.

    © 2022 Raw Trading Ltd | All rights reserved.
    • Sample Page